R BiostatLIVEResearch Sprint
You have the data. Do you know what to do with it? In 3 days, take one real study from the protocol to reported results in R, step by step, the way a biostatistician works. Then bring every question to the live session with Dr. Mohammed Tarek.
A focused workshop on one study
Wed 4 Nov · 3:00 pm Cairo
Protocol to reported results
For the whole sprint
Statistics sticks when you do it, not when you watch it.
Short and intensive on purpose: 3 days, one study, one live session. You move fast, you finish what you start, and you leave knowing the whole workflow.
"One of the best ways to learn is learning by doing. That's why we built the R Biostat Research Sprint."
Dr. Mohammed Tarek
- Most people learn statistics as theory. Here you learn it the way it is used: on one real study, step by step.
- You work like a biostatistician: you receive the raw data and take it all the way to reported results.
- Then you join the live session to ask your questions and go back over anything that wasn't clear.
One study, from protocol to results
You follow a complete study in the same order a biostatistician works through it.
Protocol & analysis plan
Start where the study starts: the aim, the objectives, and the statistical analysis plan written into the protocol.
R & RStudio
Install R and RStudio and get your workspace ready before you touch the data.
Data management
Receive the raw data as a biostatistician and prepare it for analysis.
Descriptive statistics
Summarise your data, check its distribution, and choose how to present it.
Statistical tests
For each test: check its assumptions, run it in R, and interpret what the result means.
Reporting results
Write up your results the way a paper needs them, with clear tables.
Your questions, answered live
After working through the study, join Dr. Mohammed Tarek live. Bring your questions, and go back over the steps that need a second look.
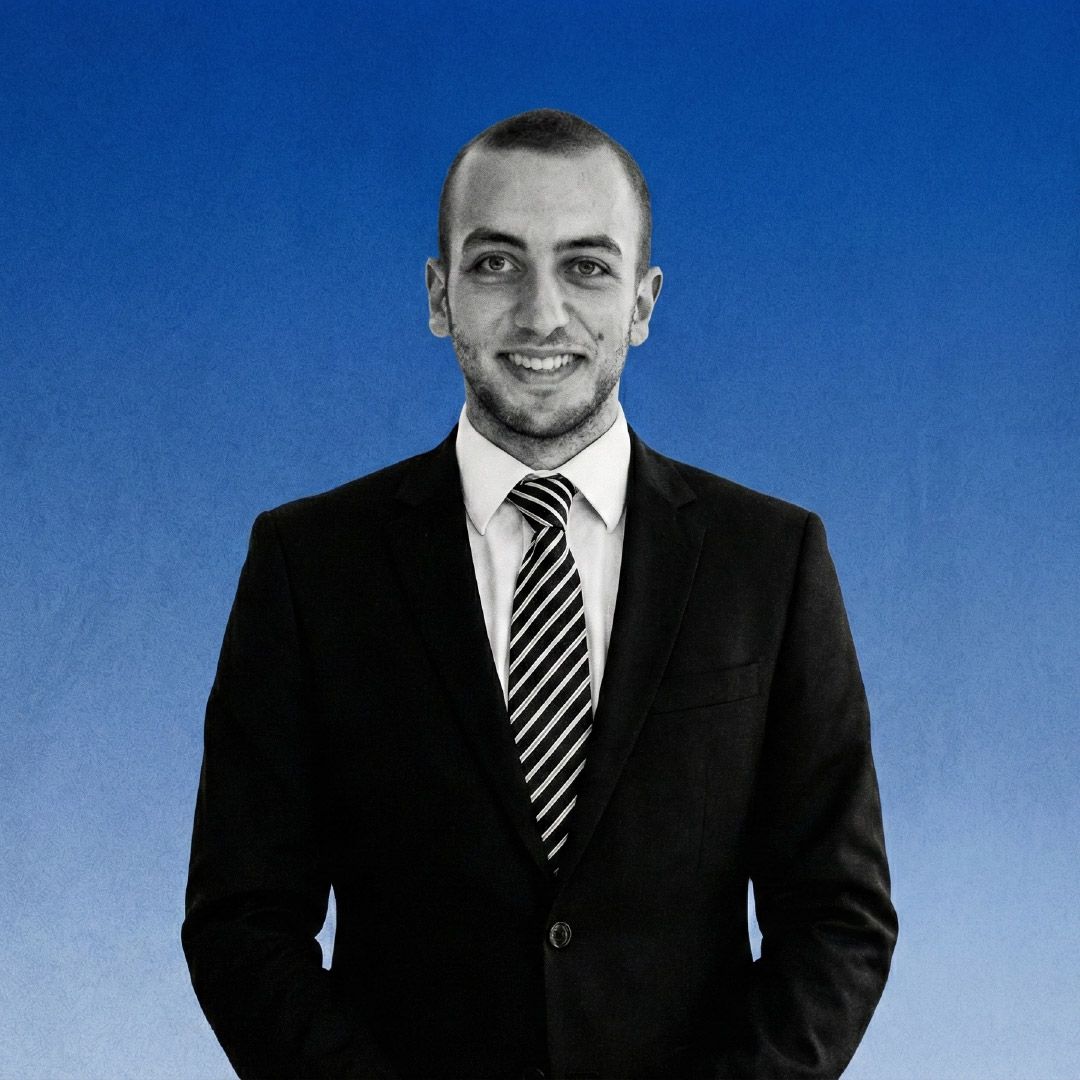
Dr. Mohammed Tarek
Clinical researcher and R biostatistics instructor at Negida Academy
Built for medical researchers, not programmers
Medical students & postgraduates
See a real analysis from start to finish, not just the formulas.
Physicians
GPs, residents and specialists who need to understand and report their own results.
Clinical researchers
Working on clinical trials or observational studies and handling the data yourself.
Complete beginners in R
Installing R and RStudio is part of the sprint, so you can start from zero.
By the end of the sprint, you can
- Take raw data and clean it in R: missing data, outliers, coding
- Describe it correctly, and know when to use mean ± SD or median (IQR)
- Check a test's assumptions, run it in R and interpret the result
- Report your results in clear, paper-ready tables
What you need (very simple)
- A laptop and an internet connection
- R and RStudio, which you install with us in step 2
- 3 days of focus, and a seat at the live session on Wed 4 Nov
Why $2, and not free?
Because the live session is for people who show up.
A real commitment
Free is easy to sign up for and easy to forget. $2 is a small step that says: I'm in, and I'll do the work.
Live time for you
The live session has limited time. We want it spent answering your questions, from people who worked through the study.
The full experience
One study, every step, and live answers to your concerns. For the price of a coffee.
Your seat in the sprint
- 3-day workshop on one complete study
- Live session with Dr. Mohammed Tarek: Wed 4 Nov, 3:00 pm Cairo
- Protocol → data management → descriptive statistics → tests → reporting
- R and RStudio setup included, no experience needed
Master R in Biostatistics for Clinical Research
Ready to go deeper? The full course covers R from the basics to regression, meta-analysis and network meta-analysis in 60 recorded lectures.
See the full course →Questions before you join?Message us on Telegram
FAQs
Do I need to know R already?
Is it live or recorded?
What will I actually do?
What language is it taught in?
Why $2 and not free?
What comes after the sprint?
3 days. One full study. One live session.
Live Q&A: Wednesday 4 November, 3:00 pm Cairo time. Your seat is $2.
Join the Sprint for $2 →